


 T-Table
 Z-Table-Positive
 Z-Table-Negative


Tags
-
ARTICLES
- iPhone X on Discount?
- Best Cisco Switches
- Missions
- Humans Trekked Out of Africa Via Egypt, Study Suggests
- SAS Tips for data handling
- Ergonomics for Clothing Industry
- Relations between Temperature, Productivity and Accident
- Statistics, F-Ratio
- Water and Fruits for Your Kidney
- ISO-9001 Differences between 2000 and 2008 Edions
- Laboratory Manual
- TQM Course Guide Book
- Some of Tourist Sites in East Gojjam, Ethiopia
- Sampling Process
- Research Methods Guide-Book
- Industrial Psychology Guidebook
- Application of Japanese Kaizen in Ethiopian Industries
- T-Table & Z-Table
- Human Computer Interactions, HCI
- Industrial Psychology: Assignment for Students
Archives
social Events
Copyright
Quality
Missions
- Accelerate appropriate technology and knowledge transfer to industries and individuals, for proper purposes.
- Link appropriate technology on the same site.
- Work with major technology carriers such as Amazon in affiliation program.
- Promote the use of Ergonomics technology/products/personal equipment that helps prevent fatigue, repetitive strain injuries, a muscular-skeleton disorder that can progress to permanent disability, and generally to enhance employee well-being at a workplace and as a result presumably improve productivity.
- Promote and link high tech router and switch products, in intention to have globally secure and fast computer networks.
- Promote and link latest computers and smartphones for enhanced performance and communications.
- Promote and link selective literature/books regardless of subject areas.
- Review and validity research papers, special tech products such mental enhancement technologies and link to their availability depending on social demand.
- Perform academic publications in collaboration with other companies such as Amazon, including non-English literature.
- Enable students in the area to be able to post their paper and share their knowledge and skills one another.
- Produce a user guide on demand.
Specific Missions
Definition of Technology Transfer
The technology (tech) transfer is a process of technology transformation from original producers to other learners or consumers via market or other means. Technology by definition involves hardware equipment, software/digital products, process, knowledge, manufacturing methods, service applications and business techniques, etc that can add values. In this context, the technology transfer process is largely committed to the transfer of equipment, any legitimate products, and software applications to a specific purpose(s). The TT’s role is providing information technology transfer to take place from producers to consumers directly or to the third party, for instance, Amazon, or TT itself.
Notice:
Individual authors are responsible for their respective publications of accuracy and compliance with copyright.
Posted in Tech Transfer
Leave a comment
Humans Trekked Out of Africa Via Egypt, Study Suggests
CLICK THE FOLLOWING LINK
http://news.yahoo.com/humans-trekked-africa-via-egypt-study-suggests-161530170.html
Posted in Tech Transfer
Leave a comment
Relations between Temperature, Productivity and Accident
TESEMA T. B.
School of Mechanical and Industrial Engineering
Institute of Technology, Bahir Dar University
Bahir Dar
Abstract
The present research is aimed at in understanding the probable intricate relationship that could exist between varying temperature, productivity, and accidents. Such an exercise has been attempted as it is the evident man is affected by abrupt variations in temperature (outdoor). Since it is generally perceived such an impact on the body and mind could affect the productivity and leads to probable accidents, this study has been undertaken to understand better this factor. To test the hypothesis, 7-years temperature data, 2006-2012, was obtained from a national meteorological service. The productivity and accident rate was collected for the same period from BD Textile Company. The data was analyzed with SPSS correlation techniques. An inverse mild correlation is found between temperature and productivity. But, correlations are not significant at p < 0.10, two-tailed. Systematic correlations are not observed between temperature and accident rate. The result is inconclusive but can be a useful input for future research, involving simulated conditions and varying ranges of temperatures, durations of exposure and stress coefficient.
Posted in Tech Transfer
Leave a comment
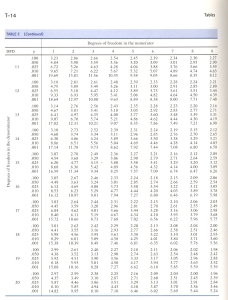
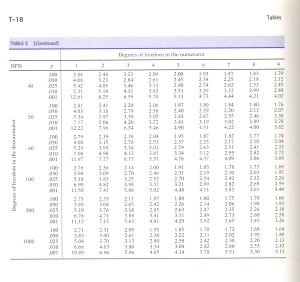
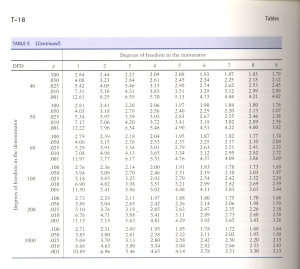
Statistics, F-Ratio
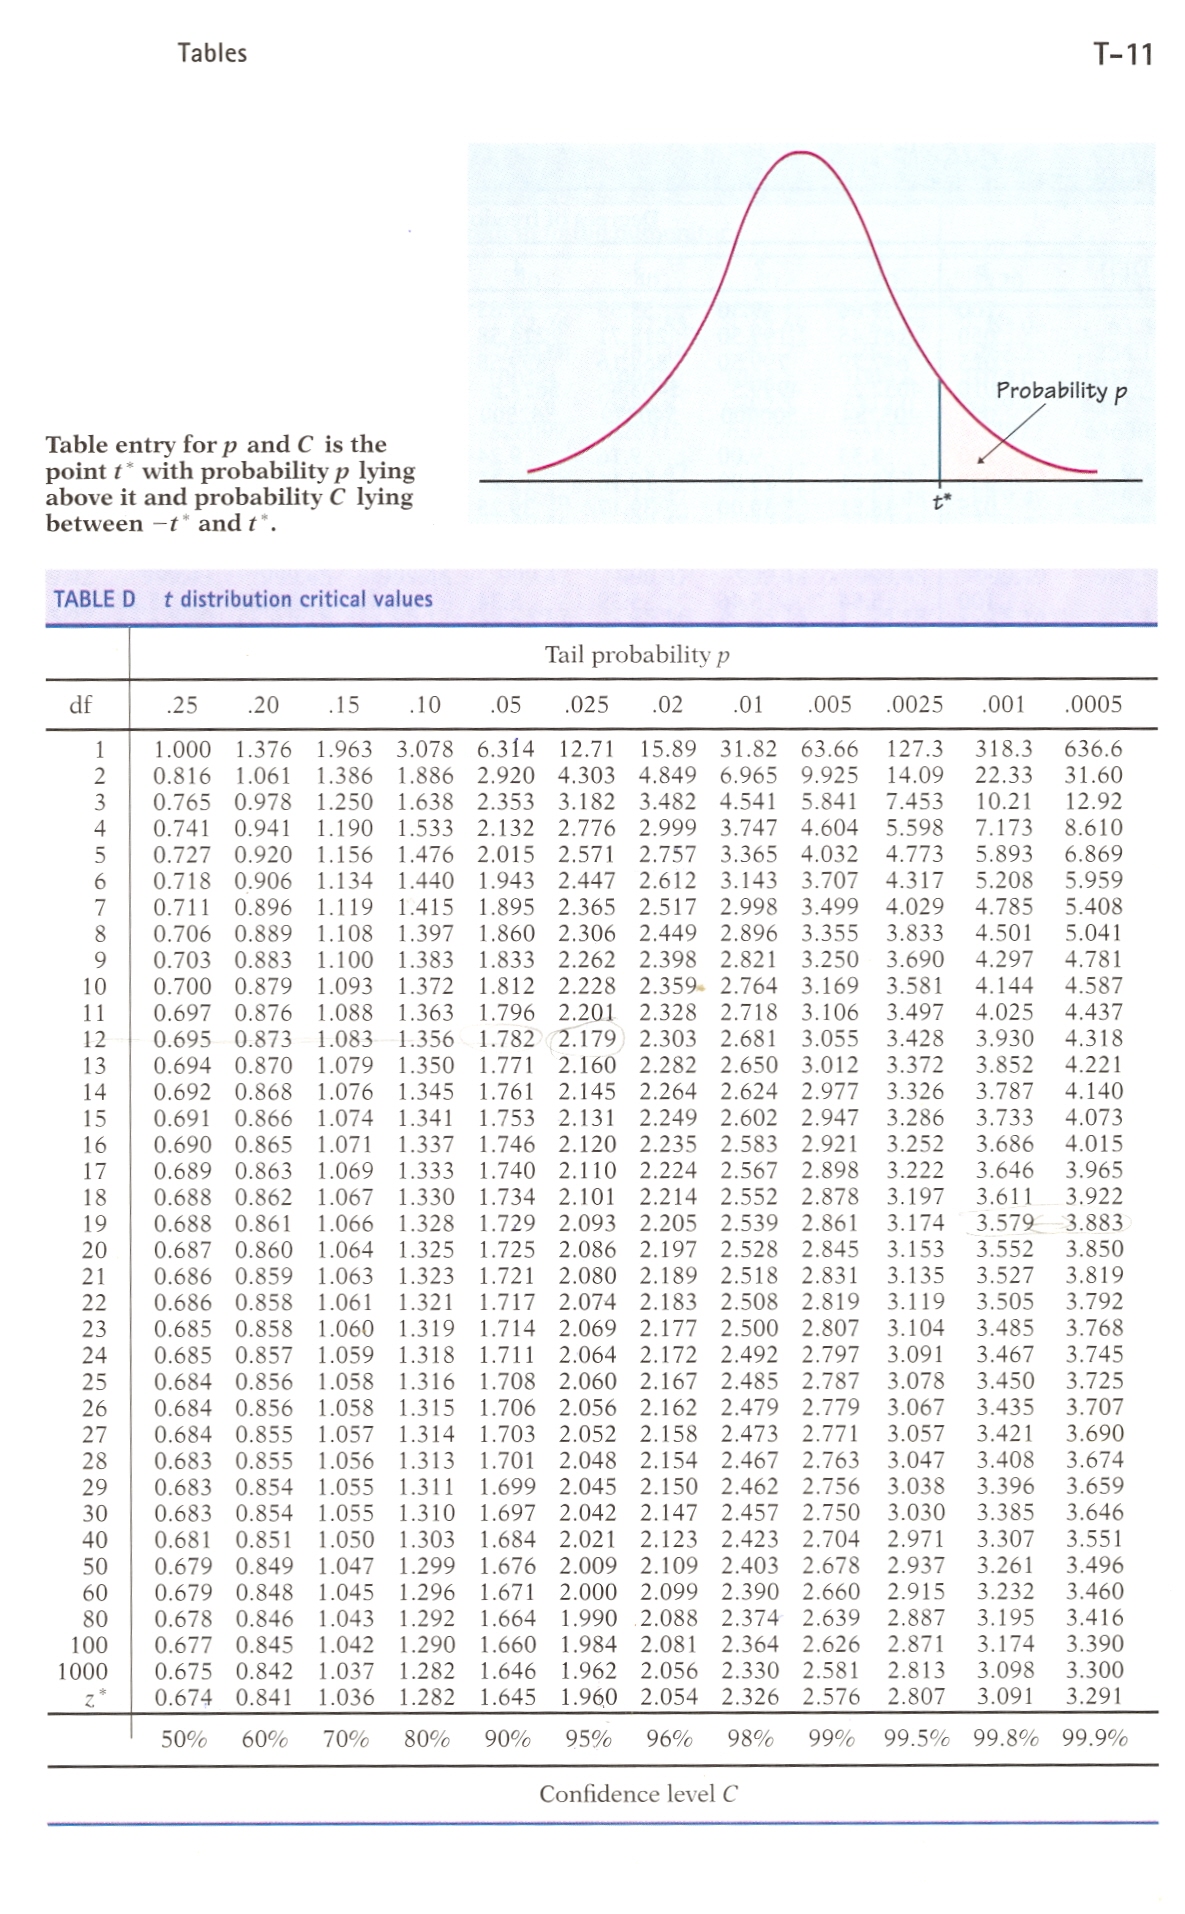
Tables T-12 through T-20 with Degrees of Freedom (DoF) of nominators and denominators are F-ratios, which means F-values, but they are not t values. If you are searching t-values you should click here, Student-Test, T-11


Posted in Tech Transfer
Leave a comment
Water and Fruits for Your Kidney
CLICK ON THE BELOW LINK: http://www.onegreenplanet.org/natural-health/cleaning-up-your-kidneys-helpful-foods-and-drinks-to-consider/
Posted in Tech Transfer
Leave a comment
Some of Tourist Sites in East Gojjam, Ethiopia
East Gojjam in Amhara Region, Western Ethiopia, possesses unexplored natural and manmade tourist attractions. Among them are the hill named Enat Amba some people also call Agaw Amba, which is found in Čoqè Mountain, East Gojjam, 23 miles, North of Debre Markos, Sinan district, 6 miles from Erebu Gebeya in a short cut road, Kebele Tamawit Gedelbet. The mountain is largest compared to other hills known as four Mekerakers located in the same area; its height is estimated to be 3,577 mt. The hill used to serve as a military garrison during the medieval period. The portion of its base is still fenced with stacked stones called Agaw Wall (Agaw Kav) without cement & concrete.
 Enat Amba (Mother Hill) at south of Čoqè Mountain
 This picture is parts of Čoqè of Mountain in dry season, southern view
 Twin stones found western side of Enat Amba within Čoqè of Mountain
Posted in Tech Transfer
4 Comments
Sampling Process
It is PDF file, which includes sampling process, data sorting, data process, scales and data collection methods, click here: Sampling Process
Posted in Tech Transfer
Leave a comment
Application of Japanese Kaizen in Ethiopian Industries
T. Belai
School of Mechanical & Industrial Engineering
Abstract
Ethiopian industries are in process of kaizen adaptation. Kaizen is a Japanese management system for improvement in quality and productivity. Analysis has been conducted based on experience and previous works to pinpoint possible bottlenecks in Ethiopian industries related to kaizen. As a result, challenges to kaizen success can be employees’ morale, cohesive team spirit development and setting up an acceptable incentive mechanism for performance.
Posted in Tech Transfer
Leave a comment
T-Table & Z-Table
Find Tables by clicking
If you are searching F-ratios (F-values) click here F-Ratios starting Table-12
Posted in Tech Transfer
Leave a comment
Industrial Psychology: Assignment for Students
The role of Industrial Psychology includes study of relationships of employees and work environment or systems. Its goal is to check the fitness of employees with jobs, or the other way around for a healthy condition and maximize performance.
As technology progress, the study/training for an effective interface/system development can be conducted on artificial environment via simulation without involving in actual workplace. This computer created artificial environment is called virtual reality. The purpose of this assignment is to introduce you with virtual reality technologies, which can facilitate understanding of human-work fitness. They are listed below. Your responsibility is to prepare brief descriptive document and present the function of a particular technology in what situation it is utilized and how it works. If possible construct from local materials portable or mountable technology on human body and demonstrate during the presentation. Two-three students are assigned in one technology.
CATEGORY-1
Technologies are as follows:
-
Z800 3DVisor – Virtual reality
-
5DT HMD 800 – Virtual reality
-
Hi-Res800 – Virtual reality
-
Visette 45 SXGA – Virtual reality
-
VR Pro SXGA – Virtual reality
-
VR1280 – Virtual reality
-
Z800 Pro AR – Augmented
-
Spatial augmented reality (SAR)
-
Human multi-modal spatial cognition
-
Spatial orientation
-
Spatial updating
-
Enabling robust and effortless spatial orientation in virtual environments
CATEGORY-2
Aptitude Test:
Aptitude test is essential for employment applicant screening. The test can also predict the individual’s best fit areas. So that, remaining two groups of the students should work on an aptitude test. Each group shall prepare 40-questions of aptitude test. Indeed, 95% of items must be objectives.
Deadline for submission: April 26
Posted in Tech Transfer
Leave a comment
WORK STUDY & ERGONOMICS ASSIGNMENTS
The students of this class are paired to work on assignments for successful course completion. The two assignments are required to be done in addition to an exam and other activity. One assignment is given in work study subject and another assignment is designed in Ergonomics/Human Factor aspects. The assignment are hereby specified in details:
-
An improved process chart development: Each pair of students are required to develop an improved process chart involved in a man with two equipments, Machine-1 and machine-2. The char must show full cycle activities in transformation of a set of input into output in details. In order to introduce the improved process chart, the pair of students first should record and investigate inefficiency in the existing process, unless the new process chart has no relevancy. For example, a process with a long cycle, longer time and input material distance to an operator is considered as inefficiency in a process.
-
Analysis of anthropometric data: same pairs of students are required to produce actual data and analyze for a design consideration. The analysis should determine mean, standard deviation and distributions of percentiles at 99, 95, 50, 5 & 1 levels. For example, the students can work on shoe or its component designs, or student class arm chairs can be sampled and tallied to find out the distribution and then percentile. Other types of data are also accepted for same context. In either of cases, existing appropriate ergonomics data or literature data will be used as reference values to determine the stated distributions. Then after, each pair of the students should redesign the same product(s) that it has analyzed as stated above. The design must accommodate at the minimum 5th to 95th percentile range.
These assignment papers should be short and to the point. The papers should also consist of three components: brief introduction, detailed analysis and conclusion. Used sources must be cited and listed properly. For this purpose, refer literature, entitled Student Project Guide at https://qualityrg4.wordpress.com. The students may be required to present their respective assignment before submission depending on the availability of the time. The first assignment credits maximum 20 points and the second one values maximum 30-points. They are submitted on July 30 and August 26, respectively in the above order list.
Posted in Tech Transfer
Leave a comment
Research Concepts and Statement of Problem
UNIT-1 (Source:Kotheri)
Meaning of Research
According to Clifford Woody research comprises defining and redefining problems, formulating hypothesis or suggested solutions; collecting, organizing and evaluating data; making deductions and reaching conclusions; and at last carefully testing the conclusions to determine whether they fit the formulating hypothesis. Research is, thus, an original contribution to the existing stock of knowledge making for its advancement, or finding new knowledge about the phenomena under study. It is the pursuit of truth with the help of study, observation, comparison and experiment. In short, the search for knowledge through objective and systematic method of finding solution to a problem is research. The systematic approach concerning generalization and the formulation of a theory is also research.


Objectives of Research
 The purpose of research is to discover answers to questions through the application of scientific procedures. The main aim of research is to find out the truth which is hidden and which has not been discovered as yet. Though each research study has its own specific purpose, we may think of research objectives as falling into a number of following broad groupings:
1. To gain familiarity with a phenomenon or to achieve new insights into it (studies with this object in view are termed as exploratory or formulative research studies);
2. To portray accurately the characteristics of a particular individual, situation or a group (studies with this object in view are known as descriptive research studies);
3. To determine the frequency with which something occurs or with which it is associated with something else (studies with this object in view are known as diagnostic research studies);
4. To test a hypothesis of a causal relationship between variables (such studies are known as hypothesis-testing research studies).
Motivation in Research
What makes people to undertake research? This is a question of fundamental importance. The possible motives for doing research may be either one or more of the following:
1. Desire to get a research degree along with its consequential benefits;
2. Desire to face the challenge in solving the unsolved problems, i.e., concern over practical problems initiates research;
3. Desire to get intellectual joy of doing some creative work;
4. Desire to be of service to society;
5. Desire to get respectability.
Types of Research
The basic types of research are as follows:
-
Descriptive vs. Analytical: Descriptive research includes surveys and fact-finding enquiries of different kinds. The major purpose of descriptive research is description of the state of affairs as it exists at present. In social science and business research we quite often use
-
Applied vs. Fundamental: Research can either be applied (or action) research or fundamental (to basic or pure) research. Applied research aims at finding a solution for an immediate problem facing a society or an industrial/business organization, whereas fundamental
research is mainly concerned with generalizations and with the formulation of a theory.
-
Quantitative vs. Qualitative: Quantitative research is based on the measurement of quantity or amount. It is applicable to phenomena that can be expressed in terms of quantity. Qualitative research, on the other hand, is concerned with qualitative phenomenon, i.e., phenomena relating to or involving quality or kind.
-
Conceptual vs. Empirical: Conceptual research is that related to some abstract idea(s) or theory. It is generally used by philosophers and thinkers to develop new concepts or to reinterpret existing ones. On the other hand, empirical research relies on experience or observation alone, often without due regard for system and theory. It is data-based research, coming up with conclusions which are capable of being verified by observation or experiment.
Defining Research Problem
A research problem, in general, refers to something has no answer in the context of either a theoretical or practical explanation and wants to obtain a solution for the same.
Quite often we all hear that a problem clearly stated is a problem half solved. This statement signifies the need for defining a research problem. The problem to be investigated must be defined unambiguously for that will help to discriminate relevant data from the irrelevant ones. A proper definition of research problem will enable the researcher to be on the track whereas an ill-defined problem may create hurdles. Questions like, what data are to be collected? What characteristics of data are relevant and need to be studied? What relations are to be explored. What techniques are to be used for the purpose?
-
Technical terms and words or phrases, with special meanings used in the statement of the problem, should be clearly defined.
-
Basic assumptions or postulates (if any) relating to the research problem should be clearly stated.
-
A straight forward statement of the value of the investigation (i.e., the criteria for the selection of the problem) should be provided.
-
The suitability of the time-period and the sources of data available must also be considered by the researcher in defining the problem.
-
The scope of the investigation or the limits within which the problem is to be studied must be mentioned explicitly in defining a research problem.
At minimum the research problem should state clearly a problem (s) to be addressed in the proposed research and the course actions to be taken (nature of data to be collected /manipulated) to carry out this research and objectives to be achieved by conduction this research. The statement of the problem can be analytical or qualitative (refer Student Project Guide for analytical formulation).
Technique Involved in Defining Problem
Let us start with the question: What does one mean when he/she wants to define a research problem? The answer may be that one wants to state the problem along with the bounds within which it is to be studied. In other words, defining a problem involves the task of laying down boundaries within which a researcher shall study the problem with a pre-determined objective in view. How to define a research problem is indeed a tough task. However, it is a task that must be tackled intelligently to avoid the puzzlement encountered in a research operation. The usual approach is that the researcher should himself pose a question (or in case someone else wants the researcher to carry on research, the concerned individual, organization or an authority should pose the question to the researcher) and set-up techniques and procedures for throwing light on the
question concerned for formulating or defining the research problem. But such an approach generally does not produce definitive results because the question phrased in such a fashion is usually in broad general terms and as such may not be in a form suitable for testing.
Defining a research problem properly and clearly is a crucial part of a research study and must in no case be accomplished hurriedly. However, in practice this a frequently overlooked which causes a lot of problems later on. Hence, the research problem should be defined in a systematic manner, giving due weightage to all relating points. The technique for the purpose involves the undertaking of the following steps generally one after the other: (i) statement of the problem in a general way; (ii) understanding the nature of the problem; (iii) surveying the available literature (iv) developing the ideas through discussions; and (v) rephrasing the research problem into a working proposition.
A brief description of all these points will be helpful.
Definition of Research Design
The formidable problem that follows the task of defining the research problem is the preparation of the design of the research project, popularly known as the “research design”. Decisions regarding what, where, when, how much, by what means concerning an inquiry or a research study constitute a research design. “A research design is the arrangement of conditions for collection and analysis of data in a manner that aims to combine relevance to the research purpose with economy in procedure.”1 In fact, the research design is the conceptual structure within which research is conducted; it constitutes the blueprint for the collection, measurement and analysis of data. As such the design includes an outline of what the researcher will do from writing the hypothesis and its operational implications to the final analysis of data. More explicitly, the design decisions happen to be in respect of:
-
What is the study about?
-
Why is the study being made?
-
Where will the study be carried out?
-
What type of data is required?
-
Where can the required data be found?
-
What periods of time will the study include?
-
What will be the sample design?
-
What techniques of data collection will be used?
-
How will the data be analyzed?
-
In what style will the report be prepared?
Keeping in view the above stated design decisions; one may split the overall research design into the following parts:
-
the sampling design which deals with the method of selecting items to be observed for the given study.
-
the observational design which relates to the conditions under which the observations are to be made.
-
the statistical design which concerns with the question of how many items are to be observed and how the information and data gathered are to be analyzed; and
-
the operational design which deals with the techniques by which the procedures specified in the sampling, statistical and observational designs can be carried out.
Features of Good Design
A good design is often characterized by adjectives like flexible, appropriate, efficient, and economical and so on. Generally, the design which minimizes bias and maximizes the reliability of the data collected and analyzed is considered a good design. The design which gives the smallest experimental error is supposed to be the best design in many investigations. Similarly, a design which yields maximal information and provides an opportunity for considering many different aspects of a problem is considered most appropriate and efficient design in respect of many research problems. Thus, the question of good design is related to the purpose or objective of the research problem and also with the nature of the problem to be studied. A design may be quite suitable in one case, but may be found wanting in one respect or the other in the context of some other research problem. One single design cannot serve the purpose of all types of research problems.
A research design appropriate for a particular research problem, usually involves the consideration of the following factors:
(i) the means of obtaining information.
(ii) the availability and skills of the researcher and his staff, if any.
(iii) the objective of the problem to be studied.
(iv) the nature of the problem to be studied and
(v) the availability of time and money for the research work.
If the research study happens to be an exploratory or a formulative one, wherein the major emphasis is on discovery of ideas and insights, the research design most appropriate must be flexible enough to permit the consideration of many different aspects of a phenomenon. But when the purpose of a study is accurate description of a situation or of an association between variables (or in what are called the descriptive studies), accuracy becomes a major consideration and a research design which minimizes bias and maximizes the reliability of the evidence collected is considered a good design.
Posted in Tech Transfer
1 Comment
Research Proposal Form
IOT, BDU
SMIE
Research Form for Students with Descriptions
This form is useable for MS students registered for course, Research Method.
(Find definitions starting from page
8)
- SUMMARY OF THE PROPOSAL:
- STATEMENT OF PROBLEM
- BACKGROUBD & JUSTIFICATION:
- METHODOLOGY
- WORKPLAN:
- FACILTYES AVAILABLE FOR CONDUCTING THIS RESEARCH PROJECT
- EXPECTED FUNDGING AGENCY:
- AMOUNT OF TIME TO BE DEVOTED TO THIS PROJECT:
- BENEFITS AND BENEFICIRIES OF THIS RESEARCH RESULTS;
- REFERENCES
- FINANCIAL REQUIREMENTS OF THE PROPOSED RESEARCH PROJECT:
|
ITEMS |
UNIT COST |
AMOUNT IN BIRR |
|
Personal: Research assessment Surveying Data entry |
|
|
|
Local Travel: Vehicle & Related Fuel Repair |
|
|
|
Field Subsistence: Per diem Interviewer Per diem Researcher |
|
|
|
Services: Laboratory Computer & Data Production Secretary Photocopy |
|
|
|
Equipment: Computer Printer Diskette Tap Recorder |
|
|
|
Consumable: Stationery materials Construction materials |
|
|
|
Communication: Fax: Tel: Postage: Internet or E-mail: |
|
|
|
Dissemination: Linkages Network |
|
|
|
TOTAL AMOUNT |
|
|
- The undersigned agrees to accept responsibility for scientific and the technical conduct of this research project, the provision of the required progress report and the presentation of the final report as required.
Name of the Investigator (S) Signature Date
—————————————– —————- ————
- RESEARCH FORM GUODELINES AND INFORMATION
The Purpose of This Guideline Is To Provide Applications with Primary Information On Filling The Research Fund Application Form. RPO Will Be Glad To Advice and Assist If Any Help Is Needed
Cover and inside pages:
The box on the front page is to be completed by the principal investigator.
Summary of the Project Proposal
In this section, summarize briefly and clearly this proposal components stated in items 211 above.
Statement of Problem:
State clearly a problem (s) to be addressed in the proposed research and actions to be taken (nature of data to be collected /manipulated) to carry out this research and objectives to be achieved by conduction this research. This statement of the problem can be analytical or qualitative (refer Student Project Guide for analytical formulation).
Background and Justification:
Provide the general background, which gave rise to the need for this research project with appropriate reference. Indicate if there have been any efforts made in this area by other researchers. It is important if available data has been exhaustively examined.
Methodology:
Describe your experimental design briefly and scientifically. Describe how it will be carried out and be tested. Be specific about what experiment you intend to conduct and why.
Work plan:
Describe briefly the activities to be accomplished, including the timetable corresponding to the expected results within work plan for the project.
Facilities available for Conducting research work:
Describe the major facilities available in the department and Faculty in which the research project is based. Describe also if there is collaboration with other departments, Faculty or any other institutions.
Any other funding:
Additional fund for the same project, if any, and its sources.
The amount of time to be devoted to the research project.
The time devoted to this research can be indicated in reference to the total engagement in the University in percent.
Benefits and Beneficiaries:
Specify the expected out put of the research and the anticipated beneficiaries. Indicated how the results of this research will be implemented.
References:
Use appropriate and selected publications, including name of the author(s), year of publication, title of the article, name of the journals, volume no, and page in that order.
Financial requirements:
List the cost of various items. The kind and type of equipment should be specified. Distinguish consumable materials from permanent. If local travel (limited) is envisaged, duration and number of persons involved should be specified.
Financial:
The money may be spent to cover mainly actual research or application cost, such as small equipment, limited local travel, casual labor cost, small workshop, etc.
Pasted from <
Posted in Tech Transfer
1 Comment
Basic Principle of ANOVA
The basic principle of ANOVA is to test for differences among the means of the populations by examining the amount of variation within each of these samples, relative to the amount of variation between the samples. In terms of variation within the given population, it is assumed that the values of (Xij) differ from the mean of this population only because of random effects i.e., there are influences on (Xij) which are unexplainable, whereas in examining differences between populations we assume that the difference between the mean of the jth population and the grand mean is attributable to what is called a ‘specific factor’ or what is technically described as treatment effect. Thus while using ANOVA, we assume that each of the samples is drawn from a normal population and that each of these populations has the same variance. We also assume that all factors other than the one or more being tested are effectively controlled. We further assume the absence of many factors that might affect our conclusions concerning the factor(s) to be studied. In short, we have to make two estimates of population variance viz., one based on between samples variance and the other based on within samples variance. Then the said two estimates of population variance are compared with F-test, wherein we work out.
F = Estimate of population variance between samples variance DIVIDED by Estimate of population variance within samples variance
This value of F is to be compared to the F-limit for given degrees of freedom. If the F value we work out is equal or exceeds* the F-limit value (to be seen from F tables No. 4(a) and 4(b) given in appendix), we may say that there are significant differences between the sample means.
ANOVA Technique
One-way (or single factor) ANOVA: Under the one-way ANOVA, we consider only one factor and then observe that the reason for said factor to be important is that several possible types of samples can occur within that factor. We then determine if there are differences within that factor. The technique involves the following steps.
(i) Obtain the mean of each sample i.e., obtain:
X1, X2, X3,…,Xk when there are k samples
(ii) Work out the mean of the sample means as follows:

(iii) Take the deviations of the sample means from the mean of the sample means and calculate the square of such deviations which may be multiplied by the number of items in the corresponding sample, and then obtain their total. This is known as the sum of squares for variance between the samples (or SS between). Symbolically, this can be written:
 SS between =
(iv) Divide the result of the (iii) step by the degrees of freedom between the samples to obtain
variance or mean square (MS) between samples. Symbolically, this can be written:
MS
between = 
Where (k – 1) represents degrees of freedom (d.f.) between samples
(v) Obtain the deviations of the values of the sample items for all the samples from corresponding means of the samples and calculate the squares of such deviations and then obtain their total. This total is known as the sum of squares for variance within samples (or SS within). Symbolically this can be written:
SS within = 

Where i = 1, 2, 2 …
(vi) Divide the result of (v) step by the degrees of freedom within samples to obtain the variance or mean square (MS) within samples. Symbolically, this can be written:
MS within = 
Where (n – k) represents degrees of freedom within samples,
n = total number of items in all the samples i.e., n1 + n2 + … + nk
k = number of samples.
viii) For a check, the sum of squares of deviations for total variance can also be worked out by adding the squares of deviations when the deviations for the individual items in all the samples have been taken from the mean of the sample means. Symbolically, this can be written:
SS for total variance = 
Where, i = 1,2,3
i= 1,2,3
This total should be equal to the total of the result of the (iii) and (v) steps explained above.
SS for total variance = SS between + SS within
The degrees of freedom for total variance will be equal to the number of items in all
samples minus one i.e., (n – 1). The degrees of freedom for between and within must add
up to the degrees of freedom for total variance i.e.,
(n – 1) = (k – 1) + (n – k)
This fact explains the additive property of the ANOVA technique.
-
Finally, F-ratio may be worked out as under:

This ratio is used to judge whether the difference among several sample means is significant or is just a matter of sampling fluctuations. For this purpose we look into the table, giving the values of F for given degrees of freedom at different levels of significance. If the worked out value of F, as stated above, is less than the table value of F, the difference is taken as insignificant i.e., due to chance and the null-hypothesis of no difference between sample means stands. In case the calculated value of F happens to be either equal or more than its table value, the difference is considered as significant (which means the samples could not have come from the same universe) and accordingly the conclusion may be drawn. The higher the calculated value of F is above the table value, the more definite and sure one can be about his conclusions.
Setting up Analysis of Variance Table
For the sake of convenience the information obtained through various steps stated above can be put as under:
Table 11.1 Analysis of Variance Table for One-way ANOVA
(there are K samples having in all n items)
| Source of
variation |
Sum of squares
(SS) |
Degrees of
Freedom (d.f.) |
Mean Square (MS) (this is SS divided by d.f.) and is an estimation of variance to be used in F-ratio | F-ratio |
| Between samples or categories
Within samples or categories |
(k-1)
(n-k) |
SS between
(k-1)
SS within (n-k) |
MS between / MS within | |
|
Total |
(n-1) |
Deluxe Power Compact Mobility Aid Wheel Chair Motorized Wheelchair, Powerful Dual Motor Wheelchair
Garmin inReach Explorer+, Handheld Satellite Communicator with TOPO Maps and GPS Navigation
Posted in Tech Transfer
2 Comments
Hypothesis Testing Continued
For example, suppose you suspect that a wire grade Injara pan has impact consumption of electricity. The sample of your experiment indicated (mean 69) with higher grade wires. With the existing lower grade wire, the population mean is 75. Formulate hypothesis at 0.05 (two-tail 0.025) and test whether actual difference between power consumption due to wire grade difference.
Ha : 75 while the null hypothesis is : Ho : = 75.
 =
=  = -2.4
We can prove the above experiment graphically as follows: Our pre-determined probability level is 95% i.e. 5% level of significance for this test. Both tests have the rejection (or critical) region of 5% i.e. 0.05. Now this rejection region is divided between both the tails of the distribution (see figure i.e). 2.5% or 0.25 in the upper tail and 2.5% or 0.25 in the upper tail and 2.5% or 0.25 in the lower tail since your hypothesis gives only a difference and not a direction. You will reject the null hypothesis on the basis that the sample mean falls into the area beyond 1.96. Otherwise if it falls into area 0.475 corresponds to 1.96, you can accept the null hypothesis.
Conclude
| Z | < z

Posted in Tech Transfer
Leave a comment
Sampling Distributions
Some important sampling distributions, which are commonly used, are: (1) sampling distribution of mean; (2) sampling distribution of proportion; (3) student’s ‘t‘ distribution; (4) F distribution; and (5) Chi-square distribution. A brief mention of each one of these sampling distributions will be helpful.
-
Sampling distribution of mean: Sampling distribution of mean refers to the probability distribution of all the possible means of random samples of a given size that we take from a population. If samples are taken from a normal population, N (m,sp), the sampling distribution of mean would also be normal with mean mx=m and standard deviation
 where u = the mean of population,
  population standard deviation and n = number of samples. Then, normal variate
  for sampling distribution mean. This characteristics of the sampling distribution of mean is very useful in several decision situations for accepting or rejection of hypotheses.
2. Sampling distribution of proportion: Like sampling distribution of mean, we can as well have a sampling distribution of proportion. This happens in case of statistics of attributes. Assume that we have worked out the proportion of defective parts in large number of samples, each with say 100 items, that have been taken from an infinite population and plot a probability distribution of the said proportions, we obtain what is known as the sampling distribution of the said proportions, we obtain what is known as the sampling distribution of proportion. Usually the statistics of attributes correspond to the conditions of a binomial distribution that tends to become normal distribution as n becomes larger and larger. If p represents the proportion of defectives i.e., of successes and q the proportion of non-defectives i.e., of failures (or q = 1 – p) and if p is treated as a random variable, then the sampling distribution of proportion of success has a mean = p with standard deviation  where n is the sample size. Presuming the binomial distribution approximating the normal distribution for large n, the normal variate of the sampling distribution of proportion
  where
where  (pronounced as p hat) is the sample proportion of success, can be used for testing of hypothesis.
3. Student’s t-distribution: When population standard deviation (s p)
is not known and the sample is of a small size (i.e., n < 30), we use t distribution for the sampling distribution of mean and workout t variable as:
 where
where 
t-distribution is also symmetrical and is very close to the distribution of standard normal variate, z, except for small values of n. The variable t differs from z in the sense that we use sample standard deviation (s s)
in the calculation of t, whereas we use standard deviation of population (s p)
in the calculation of z.
4. F-distribution: if ( )2 and (
 )2 are the variances of two independent samples taken from two normal dependent population, but having same variance,
  the ratio of F =
  where
where 

5. Chi-square (c) 2
distribution: Chi-square distribution is encountered when we deal with collections of values that involve adding up squares. The generalized shape of c2
distribution depends upon the d.f. and the c2
value is worked out as under:
 where i=1
How to Conduct Various Statistical significance t-Tests
T-significance tests are required when sample size is 30 or less. The test will determine whether the population the sample has been drawn is normally distributed and the sample has been randomly taken.
Different types of t-tests conducted as follows:
-
To test the significance of the mean of a random sample:

 mean of sample
u=mean of univers/population
 =standard error of the mean worked out under:

The degree of freedom = (n-1)
-
To test the difference between the means of two samples:

 = Standard error of difference between two sample means worked out as:

d.f= n1 + n2 – 2
-
To test the significance of the coefficient of simple correlation:
 or
or 
Where, r = coefficient of simple correlation and the d.f = (n-2)
-
To test significance of the coefficient of partial correlation:
 or
or 
Where, rp is any partial coefficient of correlation and d.f = (n-k), n being the number of pairs of observations and k being the number of variables involved.
Posted in Tech Transfer
Leave a comment
